

Most CRM stacks still lean on what customers say, click, or buy. That leaves a gap between behaviour and record. Video analytics helps close it by turning visual evidence, like movement patterns, queue pressure, and on screen reactions, into structured signals you can attach to accounts, locations, campaigns, and service events.
When you treat video as data, the value shows up in practical places. You can tune staffing to reduce waits. You can test layouts using heatmaps rather than hunches. You can spot where a demo loses people, then fix the script or the product step. The point is not “more footage.” The point is better decisions backed by repeatable measurement.
How to integrate this into CRM without turning it into a science project
Start with a narrow objective and a clear data route. For example, you might want to reduce queue-related complaints at a specific location type, or increase demo to trial conversion for a specific segment. Then decide what video signal supports that goal, such as dwell time near a help desk, queue length over time, or recurring friction moments during onboarding. In practice, the cleanest pilots attach analytics to one workflow, like “store visit plus follow-up,” rather than trying to instrument every touchpoint at once.
Operationally, file handling becomes the first bottleneck. Teams often pull clips from phones, webcams, CCTV, and conferencing replays, then discover that formats vary and transcripts fail. A simple step like standardizing inputs with a video converter online can keep ingestion consistent, which reduces rework and helps analytics run reliably across sources.
Most organizations also end up adding small workflow helpers, because adoption lives or dies on friction. AI tools can draft summaries, extract themes from transcripts, and propose next actions for a record. Chrome extensions can let staff clip a timestamped moment from a browser-based replay and attach it to a case note, so insight stays connected to the customer thread without someone doing manual copy and paste. Keep these as supporting mechanics, not the product story, and they will quietly raise usage.
What the evidence says you can achieve
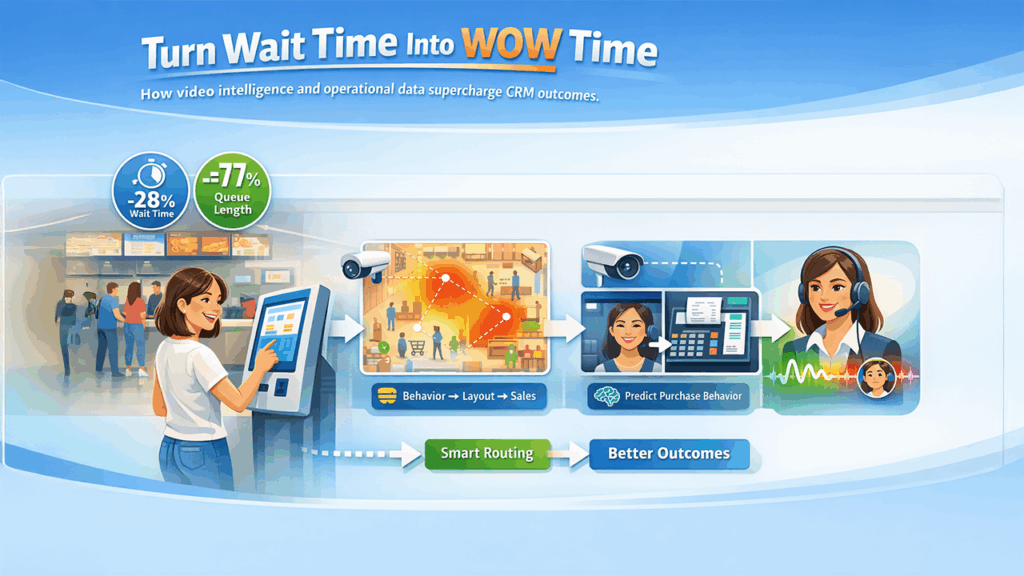
In physical service settings, reducing wait time tends to produce immediate experience gains. A 2025 simulation study of a hybrid ordering setup in fast food found that an optimal kiosk to counter configuration reduced total average wait time by 28% and reduced average queue length by 77%. Those are operational numbers, yet they map cleanly onto CRM objectives because wait time drives complaints, churn, and repeat visits.
In retail analytics, research keeps pointing to the same mechanism. Track movement and attention, then adjust layout and placement. A 2024 paper in Electronics describes a computer vision approach that uses tracking plus object detection to generate in-store heatmaps, with the stated goal of improving product placement and store layout decisions based on observed customer interaction patterns. That is exactly the kind of signal a CRM team wants, because it links what people do in the space to what they later buy, ask, or return.
There is also emerging work that connects video-derived features to purchasing outcomes. A 2023 study (revised 2024) combined in-store camera data with transaction data and used computer vision to extract features, including emotional expression and context, to predict offline purchase decisions. The key takeaway is the idea that video signals can improve prediction when you join them to the same customer and transaction records a CRM already holds.
In contact and support contexts, emotion recognition research shows why visual and audio signals matter. A 2024 study in Applied Sciences reports a deep learning approach for call center emotion recognition using real customer data, with reported accuracy around 0.91, and it frames the operational benefit as routing or preparing agents based on caller emotional state. You can apply the same logic to video meetings, recorded demos, and support clips, then feed the insight back into case handling and follow up workflows.
What to measure so you can prove value
If the goal is CRM improvement, measure outcomes that the CRM already tracks, then connect them to video derived signals.
- Queue pressure versus case volume, to see whether wait reduction corresponds with fewer complaints.
- Dwell time and heatmap shifts versus conversion or basket outcomes, to test whether layout changes move revenue, not just movement.
- Demo friction moments versus trial activation and renewal rates, to validate that you fixed the right step.
- Emotion or sentiment flags versus escalation rate and resolution time, to check whether routing and prep improve service handling.
That structure keeps the story company specific even when the research stays general. You are claiming that better observation supports better operational decisions, and the studies above show concrete pathways where that happens. One final practical point: build a feedback loop. When teams see a metric shift, they should tag what changed in staffing, layout, scripting, or training, so you can attribute improvement rather than just celebrate correlation. That documentation turns analytics into a repeatable playbook.
%201.png)

%201.png)

%201.png)