


Based on the KPMG report “From Data Overload to Data-Driven Decisions in Retail (2025)”,big data in retail and big data analytics in retail today face three critical challenges: price accuracy, SKU health, and fraud detection.
“We are using data to understand where we can improve and push the boundaries to determine what we can actually do to exceed our promises and commitments we make to the customer.” — Vijay Jerome, Senior Vice President & Head of Global Operations, H&M
Retailers today juggle a storm of data—from online carts to in‑store scans, competitor sites to customer reviews. Like for
This guide explores how do big data analytics help retailers in their business—by turning fragmented inputs into real-time pipelines that prevent price erosion, stockouts, and fraud.
How Big Data Problems Are Solved In the Retail Sector
Big data analytics in retail market report highlights that merging POS, e-commerce, CRM, and competitor feeds into a single, rule-driven ingestion layer effectively stops data silos in their tracks. One retailer, for example, unified ten price streams into one system. With regex-based SKU recognition and rule-based classification, they could spot price drops or MAP violations in under six hours. Outcome? A 12% margin recovery quarter-over-quarter.
Based on the essential insights of KPMG 2025, analyzing pricing trends, evaluating the least cost flexibility, and create personalized discounting tactics is crucial than ever.
Main Takeaways: With lack of strong foundation, steady classification rules, continuous tagging, these informed insights can cause hidden instability.
Let’s understand how big data analytics transform retail industries: These industries not only utilize big data for creating compelling dashboards, instead they are used to turn insights into actionable workflow. Similarly for supply chain management, SKU-level alerts help business get informed when stock is overflowing or running low. And for fraud prevention, real-time analysis of shopping cart pattern and refund behavior help reduce the risk of fraud by 30%.
Application Areas: Big Data in Retail Industry
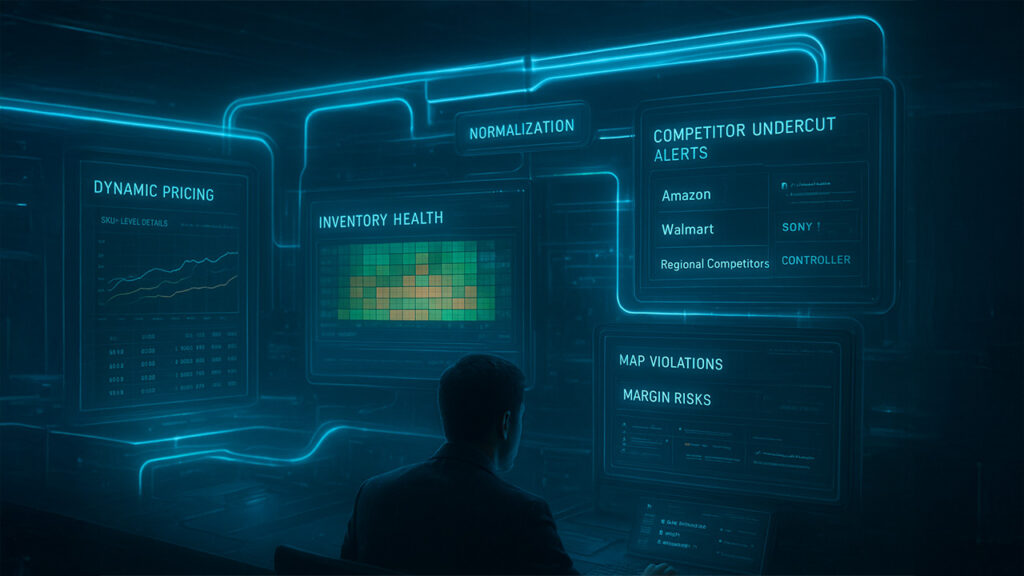
Modern retailers aren’t just selling products, they are also responsible for managing thousands of informed decisions everyday. This includes dynamic price adjustment, MAP (Minimum Advertised Prices) enforcement, real-time stock management, regional demand pattern, and SKU-level customer sentiment. To survive, big data in retail must flow through structured systems that combine extraction, normalization, classification, and alerting. But what does that look like in 2025?
How Retailers Use Structured Feeds To Track Dynamic Pricing
GroupBWT shared with us how do they use big data in the retail domain, offering practical insights into pricing, demand prediction, and inventory optimization.
In one case, a leading electronics retailer was losing margin across 20+ marketplaces due to silent undercutting on variant SKUs (e.g., color, bundle, refurb status). Unlike conventional visualization tools that may fail to detect these deltas in real time, retailers shift to a event-based infrastructure to resolve this issue.
- Regularly check price and availability of stocks across Amazon, Walmart, and regional competitors to stay ahead of the market.
- Consistently updating product names with regex and synonym mapping (e.g. “PS5 Console Bundle” = “Sony PS5 1TB + Controller”)
- Flagging undercut or MAP-violating SKUs in under 4 hours
- Pushing auto-alerts to pricing teams and vendor relations
This reduced margin leakage by 12% in Q2, primarily by catching silent violations 3–5 days earlier than before.
Big Data, Small Windows
This is what big data analytics in retail looks like when it works. Not dashboards. Not delayed quarterly summaries. But a pipeline that catches micro-errors before they roll up into missed targets. The retailers that win are those who embed decision logic where the data is, not three layers later in a spreadsheet or summary chart.
This shift isn’t just about adding more tools—it’s about aligning logic, timing, and roles. The winners are not those with the most dashboards, but those with pipelines that act when risk is still invisible.
Why Pipelines, Not Dashboards, Are The Real Margin Protectors
Dashboards show you yesterday’s view. Pipelines catch micro-errors—like silent discounts or replenishment delays—before they cascade into full-blown margin erosion.
Take SKU health. For one regional retailer, slow-moving product variants piled up unnoticed in one region because their BI refresh happened only weekly. A real-time pipeline—ingesting warehouse logs and sales scans—now flags variants approaching threshold levels, pushing notifications the moment inventory dips or pile‑ups begin. That’s how big data analytics operates, not just informs.
The damage? Stockouts now cost that retailer 5% less in lost sales, while overstock reduction saved a further 3%. That kind of hit is real money.
Three Game-Changers in 2025 Retail Data Strategy
1. Real-Time SKU-Level Alerting
Old model: Omni-channel data merges overnight. You notice the demand shifts a day too late.
New model: Real-time feeds with micro-logic. At signal time, pipelines tag SKUs. Gestures like “auto-reorder” or “promo pause” can fire instantly.
What It Means:
- Avoid excess or empty aisles.
- Free cash is tied to inventory.
- Planning moves from reactive to proactive.
2. Intelligent Fraud Detection, Instantly
Reimbursement fraud is subtle yet costly. Someone returns 20 items—low-cost but high-risk—across multiple orders in under a week. In a dashboard? You spot it too late. In a fraud-aware pipeline? You catch it midstream.
The system analyzes basket behavior using RFM scores, anomaly classes, and statistical baselines per SKU category. High-risk baskets are flagged via real-time ML thresholds (e.g., >2σ deviation from normal return-to-purchase ratios within 48h).
In one pilot, this logic flagged fraud-prone orders within 10 minutes post-checkout. Merchants cut refund losses by ~30% while preserving shopper trust.
3. Competitor Alarms, Automated
Competitors will undercut. That’s expected. What’s not expected? Silent price cuts on variants you don’t track. With scraped feeds, regex normalization boosts SKUs into a mirror catalog. If your PS5 1TB bundle is sold cheaper elsewhere, you’ll know in under 4 hours—and act.
Margins on electronics rose by 12% simply by enforcing return-to-MAP rules faster than competitors could react.
How Do Retailers Build These Big Data Engines?
It comes down to four foundational layers:
1. Event-Driven Ingestion
Use cloud functions, batch jobs, or stream listeners to pull data from POS, inventory, competitor APIs, and review platforms. As data arrives, pipelines timestamp and tag it immediately.
2. Metadata and Classification Logic
Don’t just store “blue widget SKU123” — classify by variant, channel, sentiment, price bracket. Regex, lookup tables, or simple ML models can tag categories consistently, even as data evolves.
3. Smart Transformation with Audit Traces
Every change happens through code, not spreadsheet edits. That means version control, audit logs, and dashboards become traceable, not static.
4. Automated Alerting and Micro-Decisions
Instead of emailing spreadsheets, pipelines push live alerts—Slack pings, vendor DMs, or system triggers (e.g., adjust price, pause promo, reorder variant).
Measuring Success: Metrics That Matter
What should retailers monitor? Beyond going flashy dashboards, they need to track the metrics that actually scale the business growth.
- Lower Margin Leakage– Evaluate how much profit you gain by eliminating hidden price undercutting?
- Stockout Frequency– Monitor which product variant stocks out in the middle of the promotion.
- Fraud Capture Rate – Share of anomalous baskets flagged before refund.
- Pipeline Latency – How fast a signal runs from input to action.
What Comes Next?
Retail isn’t static. As traditional retail transforms and e-businesses revolutionize, structured pipelines will become the foundation of interconnecting inventory, promotions, and sentiment analysis into a single, comprehensive system.
- Integration of Inventory with Promo: Linking marketing campaigns to inventory health Pipelines can reduce the overstock likelihood by approx. 20%.
- Extensive Sentiment Analytics: Leverage advanced sentiment logic to monitor reviews at the variant level, allowing teams to catch quality issues before return rates strikes.
- Geographic Aware Pricing: Integrating regional competitor price scraping with store cluster data keeps price affordable and local.
Every innovation rests on the same foundation: structured feeds, metadata clarity, audit trails, and event-based logic.
Your Takeaway: Stop Tinkering, Start Structuring
If you’re running multiple dashboards—stop. Move upstream where impact lives.
Ask yourself three questions:
- Do your SKUs have real-time classification and alert systems?
- Does your pipeline log every transformation with version control?
- Are decisions automated—or still stuck in spreadsheets?
If not, that’s where your biggest margin upside lies.
What You Can Do Today
Retail margins in 2025 won’t come from more dashboards. They’ll come from clean feeds, structured logic, and split-second execution—built into pipelines, not patched onto dashboards.
- Start tracking SKU-level alerts for stock and price.
- Put rules in code, not spreadsheets.
- Layer in metadata tagging early in the pipeline.
- Set auto-alerts that tie to specific micro-actions.
Those are the moves separating analytics theater from margin protection.
The retailers who embrace this win. The rest stay reactive.
FAQ
1. What makes retail data pipelines legally defensible?
Legal defensibility starts with traceability. That means pipelines must log every data transformation—who changed it, when, and by what rule. Without version control and audit logs, even accurate reports fail compliance checks. GDPR, PCI DSS, and SEC-aligned pipelines document every step, not just results.
2. How do retailers connect online and offline behavior in practice?
By stitching shared identifiers across POS and digital loyalty IDs, emails, ZIP codes, or device fingerprints. After combining, shopping basket trend and store scrolling pattern highlights when product is explored online, tested in store, and purchased from anywhere. This multi-channel collaboration facilitate intelligent promotion timing and region-specific customized stock flow.
3. Why do various AI-driven retail models underperform after deployment?
Because they’re trained on unstructured, unclassified, or biased data. If SKUs aren’t normalized, variants are misread. If discounts aren’t logged, price elasticity fails. Most “AI in retail” use cases fail not due to model quality, but poor upstream data quality. Structured ingestion is more predictive than better algorithms.
4. How do smart pipelines adapt to assortment volatility?
This requires you to seeing your product mix as a dynamic indication, not just a fixed lost. Retail pipelines use metadata tagging (e.g., color, region, bundle) to spot cannibalization, shifting demand, or new competitor positioning. When SKUs enter or exit the catalog fast, only pipelines with schema-aware logic keep performance metrics valid.
5. How can retailers spot hidden margin drains without dashboards?
The fastest-growing tactic is anomaly triangulation: combining price deltas, basket abandonment, and micro-inventory lag in real time. Pipelines that detect these signals in under 5 minutes often find what dashboards miss for days, like auto-applied promo bugs or overlapping regional discounts that no team manually approved.
Related Posts:
The ultimate guide to web analytics in 2025: go beyond google analytics
Top Healthcare Data Analytics Companies Enhancing CRM for Medical Providers
%201.png)

%201.png)

%201.png)