
In this rapidly evolving and data-driven world, organizations need more advanced tools if they want to derive actionable insights from complex information. Comprehensive visualization platforms can assist with such tasks. They are built to increase situational awareness and operational intelligence in emergency control rooms.
How to Streamline Complex Data into Clear Insights
Control rooms act as nerve centers for multiple industries such as utilities, public safety, and energy sectors. In these settings, operators are given several responsibilities, like tracking a large amount of data stream from sources such as SCADA systems, monitoring GIS platforms, weather changes, and security alerts. However, managing this vast amount of information into a concise and comprehensible format can be challenging.
To tackle this challenge, a comprehensive visualization platform arranges diverse data into unified visual forms. Now, these displays allow operators to see the real-time operating conditions of systems and make informed and data-based decisions easily. Improved capabilities such as geospatial overlays, customized dashboards, and systematic visuals ensure easy access to all relevant information.
Data Visualization Software: Enhancing Decision-Making
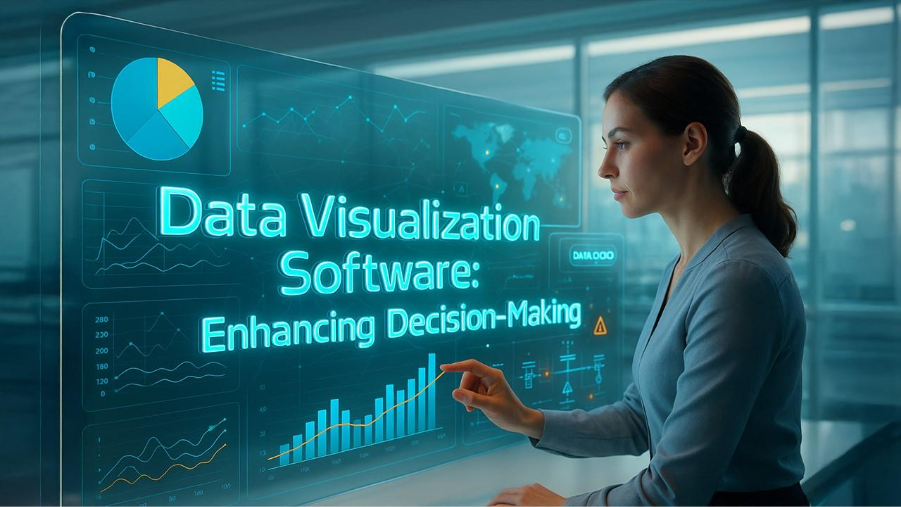
At the heart of this transformation is data visualization software. This software converts unstructured data into visual formats such as graphs, charts, maps, or dashboards. In this manner, operators can efficiently comprehend immense amounts of information and recognize meaningful insights. Visually presented data can help operators recognize patterns, trends, and abnormalities which are essential for quick decision-making in urgent situations.
Let's take an example of power grid operations; visualization tools can livestream transformer loading, energization levels, and erroneous areas on centralized dashboards. With this synthesized view, operators can easily access grid conditions and take appropriate measures instantly.
Intelligent Display Management and Customization
Practical control rooms also insist on smart display management. Operators can utilize this flexible platform to adjust content for a video wall and modify dashboards to address their specific operational requirements. Customizable displays give operators the ability to have anything they may need at their fingertips, whether it be the location of crew members, a continuously monitored health status of a system, or the ability to send a weather alert.
The Configuration Editor also has the capability to add dynamic display customization where visual elements can change based on current operational needs in real time. Adaptability and timely responses are necessary in rapidly evolving environments.
Improved Situational Awareness and Real-Time Monitoring
For enhanced situational awareness, continuous real-time monitoring is necessary. Advanced visualization capabilities collect data from various sources and processes to give operators fresh data and updates about system status. With the growing adoption of Internet of Things (IoT) Enabling Technologies, control rooms now have access to an unprecedented volume of real-time data from connected sensors and devices across their operational infrastructure. This continuous flow of information empowers operators to detect anomalies, anticipate potential issues, and implement corrective actions promptly.
Improved situational awareness enhances operational efficiency while ensuring safety and reliability. Intuitive data presentation is convenient and easy to understand, which minimizes the likelihood of errors and enhances overall system effectiveness.
Improved situational awareness enhances operational efficiency while ensuring safety and reliability. Intuitive data presentation is convenient and easy to understand, which minimizes the likelihood of errors and enhances overall system effectiveness.
Easy Integration with Current Infrastructure
Modern visualization systems can easily integrate within existing operational technologies and IT systems. These platforms support various data protocols and communication standards, allowing them to connect with legacy SCADA systems, IoT sensors, database management systems, and third-party applications without any need for extensive infrastructure overhauls. Interoperability assures organizations that they can continue to invest in existing tools and systems while improving the overall visualization process.
As a key information repository from numerous sources themselves, these solutions reduce data fragmentation and provide a coordinated operational perspective. This integration functionality decreases setup costs and time and provides comprehensive insights to operators without the need to hop around each system or interface.
Collaborative Decision-Making and Multi-User Functionality
Modern control room environments do not operate in isolation because advanced visualization platforms understand how important it is to perform collaborative operations. These platforms are powered by multi-user functionality, allowing several operators and team leaders to access, engage, and share visual data simultaneously across multiple distinct locations. Role-based access controls ensure relevant information to each team member based on their responsibilities while adhering to security regulations.
In case of serious accidents, operators can explain displays, highlight concerned areas, and share detailed views with remote specialized experts or specific management teams to coordinate appropriate measures. This collaborative method eliminates communication barriers and allows faster and informed decision-making across all levels within an organization. The options to archive and replay visualization sessions also aid in post-incident analysis and training activities, enabling teams to refine their operational response.
Conclusion
In summary, a holistic visualization platform is a requirement for modern control room operation. Comprehensive visualization platforms help significantly with situational awareness and operational intelligence, as they offer customizable visualizations, aggregate data from multiple sources, and present data in real-time. With increasing complexity and increasing volumes of data, it may be prudent to invest in highly visual software to maximize efficiency and effectiveness.
%201.png)

%201.png)

%201.png)