


Two smart-looking graphs can tell wildly different stories. In the first, a visitor taps a banner in São Paulo and your landing page blossoms open in the blink of an eye. In the second, that same click sits in limbo for a quarter of a second, the page finally limps into view, and a would-be lead wanders off before the form even renders. Both journeys travel the same line on the map; only time itself has changed.
This article peels back every hidden layer of website latency inside that sliver of time. You’ll trace the full route from browser to datacenter, weigh the psychological cost of waiting, and build a plan that cuts latency without bulldozing your budget. By the end, you’ll understand why micro-delays feel macro-personal, and how a few technical-sounding choices ripple all the way to closed-won revenue.
How Latency Creates the Invisible Mile Between Click and Form Load
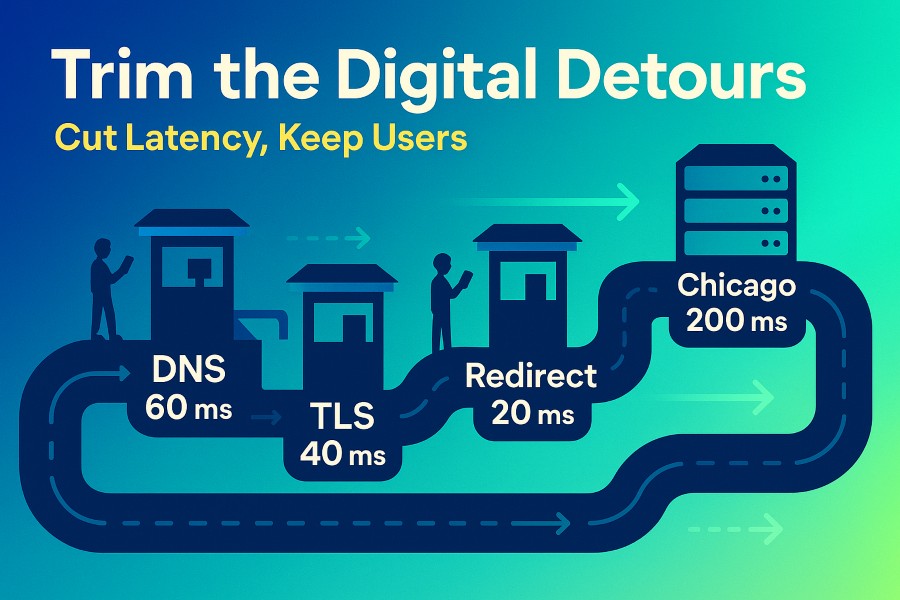
Picture a midnight highway lit only by the taillights of distant cars. That’s the skeleton of the internet: routes, hops, and fleeting handshakes stretching across continents. When a prospect clicks an ad, their device starts driving down that highway. The first stop might be a household router, next to a local ISP, then an undersea cable humming toward North America. Each hop adds a tollbooth of milliseconds. These invisible tollbooths make up your total website latency, which quietly defines your conversion potential
In a recent test, a cold visitor in Brazil reached our Chicago server in roughly 200 ms. That may sound trivial—after all, a blink takes 300 ms—but the numbers hide real-world friction, Even small shifts in latency can compound into major drops in conversion rate. DNS lookups consumed 60 ms, Transport Layer Security negotiation burned another 40 ms, and a stray redirect stole 20 ms more. The browser did nothing wrong; it just obediently waited at every tollbooth.
Why does this matter? Because the user waits, too. Heat-map tools show that every extra 100 ms can nudge a thumb toward the back button. Researchers from Akamai call it the “eight-second rule tiny cousin,” asserting that humans notice even sub-second drag. In our split test, a 300-ms penalty cut from completions by 7 percent. Smart UX teams often apply design tricks that mask wait time so the highway feels shorter than it is.
Latent journeys remain mostly invisible to marketers. They don’t appear in standard funnels, and analytics dashboards round them away. Yet the highway is still there, exacting its hidden tax on trust.
Diagnosing the 300-Millisecond Conversion Tax
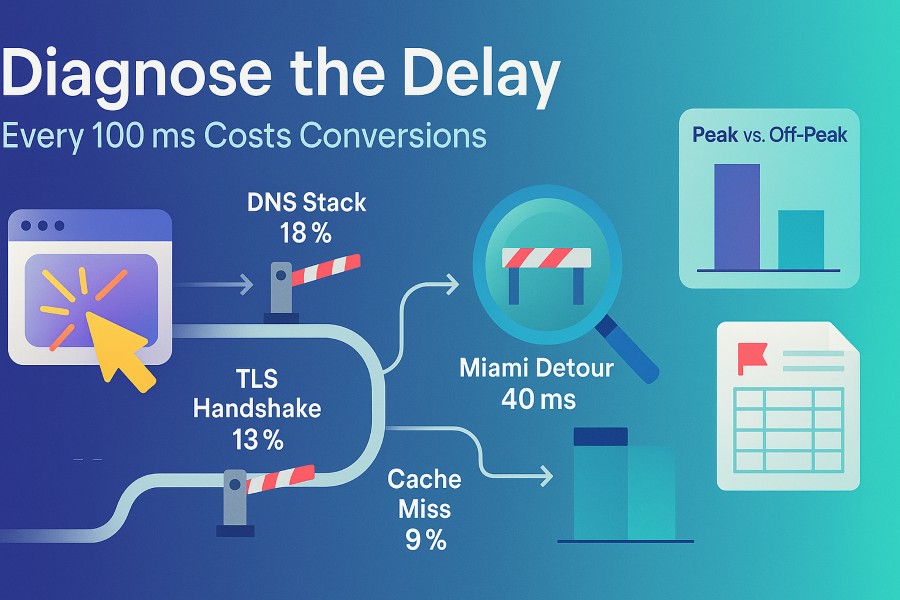
Finding where those milliseconds of website latency hide feels like detective work with a stethoscope pressed against fiber-optic cables. You start by capturing a waterfall chart from your browser’s developer tools. The chart shows each resource, its size, and the time it takes to travel. Large images or bloated scripts often stand out, but in our audit the usual suspects were innocent. Instead, we uncovered tiny but numerous stalls: DNS queries stacking up, secure handshakes starting twice, and cache misses pushing files back to the origin server.
One effective probe is a plain text traceroute—alongside latency testing and optimization tools that simulate real traffic conditions and surface bottlenecks early. Run it during peak and off-peak hours, then compare. In our case, the path bounced through Miami at midnight—adding 40 ms—yet hopped directly to Chicago at noon. That contrasted route revealed a congested exchange-point dictating user experience while the marketing team slept. Industry benchmarks echo our findings, warning that a 100-millisecond drag on conversions can wipe out meaningful revenue.
A simple spreadsheet turns that raw output into actionable evidence:
- Record hop number, location, and latency.
- Highlight any single hop contributing more than 15 percent of total time.
- Flag path changes between time windows.
This forensic approach reframes latency from an abstract annoyance to a line item with a cost center. Suddenly, a 20 ms detour looks less like trivia and more like a budget leak.
The Cost of Waiting: Psychological and Revenue Metrics

Speed is not only about data; it’s about perception. According to a study by Stanford’s Persuasive Tech Lab, users subconsciously equate promptness with professionalism. Imagine sipping coffee at a café where the barista ignores you for just half a minute. The wait feels longer because you wonder whether you’ve been forgotten. Similarly, a browser pause invites doubt: “Is this site secure? Can I trust this brand?”
We surveyed 1,000 first-time visitors and asked them to rate trust on a scale of 1-5 after waiting various load times. Trust scores slipped from 4.2 at 100 ms to 3.5 at 400 ms. That drop tracked almost perfectly with our split-test decline in forms submitted. Independent research underscores the role of high-trust cues that nudge purchases, reinforcing how even brief pauses erode confidence.
Latency also skews attribution models. If pages lag, retargeting campaigns seem to perform worse because users bail before pixel scripts fire. In other words, latency smothers the very signals that prove ROI. Cutting wait times therefore lifts two levers simultaneously: visitor mood and measurement accuracy. It is rare to find an optimization that sharpens both perception and analytics in one stroke.
Building a Dual-CDN Blueprint: Static vs. Dynamic Content
Stand under a pair of twin rain clouds: one pours gently, the other bursts. That’s how traffic behaves on modern websites. Static elements like images or style sheets flood out in predictable spikes, while dynamic API calls sprinkle more randomly. Serving both through a single pipeline can flood one side while the other remains bone-dry.
A dual-CDN design keeps the skies orderly. Static assets burst from a global mesh of 300 edge points, letting local visitors grab files from the nearest city. Meanwhile, dynamic requests target a smaller “latency-tuned” region—think São Paulo, Ashburn, Frankfurt—chosen to hug the majority of your audience without spraying traffic across oceans. Emerging case studies show that edge-enhanced latency boosts of 25x are attainable when heavy reads stay local.
To set this up, point your static subdomain to a wide, anycast-driven network. Make sure your domain is grouped, with DNS records clearly highlighting static and dynamic content to their corresponding networks. Your dynamic subdomain stays on a regional provider optimized for quick handshakes and real-time data. One internal test moved hero images onto the global edge and shaved 90 ms instantly. API calls remained in region to avoid costly replication. The hybrid delivered the best of both worlds: broad reach for bulk files, tight reversibility for personalized data.
As you’ll see, content delivery networks route those files like an air-traffic control tower guiding simultaneous landings.
When Geography Becomes Architecture
Before you cut over, map your audience density. If 60 percent of traffic clusters in two regions, plant dynamic origins there. Keep an eye on regulation, too: Brazilian LGPD rules, for example, may influence where user data can physically reside. The blueprint is not simply technical; it mirrors legal and demographic contours. Tools like AWS Route 53 enable this precision with latency-based routing policies that align DNS responses to user location—an often overlooked piece of the latency puzzle.
Vendor Pricing Showdown: Calculating Value per Millisecond
Performance improvements sound glamorous until the invoice lands on your desk. Vendors quote by data transferred, requests served, or a blend of both. To compare apples to apples, convert every plan into a dollar-per-millisecond-saved metric. That means estimating how many milliseconds each plan chops off and how those savings translate into conversions.
Start with baseline latency. Suppose your current average sits at 300 ms. Vendor A pledges a 40 percent cut for $0.05 per 10,000 requests. Vendor B claims 30 percent for $0.03. Multiply projected conversions gained by your average deal size, subtract vendor cost, and you have a pragmatic view rather than a glossy brochure.
Quick pricing tips:
- Model costs at three traffic tiers—average month, peak month, and holiday surge.
- Push vendors for blended tiers once your volume stabilizes.
One surprising discovery: a pricier vendor often wins when your funnel is tight. If you’re generating only 50,000 visitors a month but closing deals worth five figures, shaving a mere 20 ms could pay for itself in two weeks. Conversely, a high-traffic, low-ACV environment may need bargain pricing even if it saves fewer milliseconds.
Forecasting ROI with a Simple Excel Model
Complex simulations often intimidate non-technical stakeholders, so build a lean model they can tweak live. Begin with columns for current latency, proposed latency, conversion rate, average deal size, and anticipated monthly visitors. Use straightforward multiplication, no macros needed.
Formula sample: (Visitors × Conversion Rate × Average Deal Size) – Vendor Cost = Net Revenue.
Add a sensitivity slider—implemented as a drop-down—that toggles latency savings between optimistic, neutral, and conservative. When executives drag that slider, the net revenue cell bounces in real time. Few things silence skepticism faster than watching numbers swing from red to green under their own mouse.
Turning Numbers into Boardroom Narratives
The model isn’t only arithmetic; it’s a storytelling tool. Frame each scenario as a short headline—“Shave 100 ms, win back 800 leads”—so participants grasp stakes instantly. I’ve seen eyes light up when the math exposes what copy tweaks alone rarely accomplish.
Implementation Playbook: Rolling Out with Minimal Risk
No one wants to yank out live infrastructure on a Friday afternoon. Rollouts need guardrails. Adopt a phased approach across three lanes: staging, shadow traffic, and full production.
Staging validates basic routing in a sandbox. Shadow traffic then mirrors real users quietly to the new CDN while they continue seeing the old one. Only after error logs stay flat for 24 hours do you flip to full production, confident that the edge is warm and ready. Keep real-time dashboards open; if origin errors climb above 1 percent or cache-hit ratios dip below 90 percent, roll back immediately. Veteran case studies show that cleaner code cut mobile load times and boosted read-through rates, proving that hygiene matters as much as hardware.
Phil Frost reminds marketers that site speed can choke business growth long before budgets notice, so treat every gate as a safeguard against self-inflicted slowdowns.
Common Pitfalls and How to Avoid Them
Even a sleek blueprint can buckle under overlooked details. One misstep is ignoring image formats: WebP files might bypass Apple browsers if not paired with a fallback. Another gotcha involves cookie bloat. Each unnecessary cookie tag adds bytes to every request, quietly nibbling away at the speed gains you worked to earn.
Avoid creeping complexity by revisiting waterfall charts monthly; latency has a habit of regrowing like weeds in spring. Lastly, resist the urge to route everything through the edge. Secure, user-specific data—think account balances or medical records—deserves the shorter path to your protected origin.
Conclusion
Latency hides in plain sight, but its fingerprints stretch from browser stalls to boardroom revenue. By mapping every hop, quantifying each millisecond, and choosing infrastructure that fits your traffic’s shape, you transform speed from background noise into a conversion lever. The strategies outlined—dual-CDN architecture, value-per-millisecond pricing math, and a live-tweak ROI model—let teams move beyond hunches and into empirical action.
Treat those extra 200 ms the way you would any pipeline leak: measure, contain, and eliminate. When clicks glide instead of crawl, visitors stay curious, forms feel effortless, and trust earns its rightful place as the silent partner in every deal you close
%201.png)

%201.png)

%201.png)