
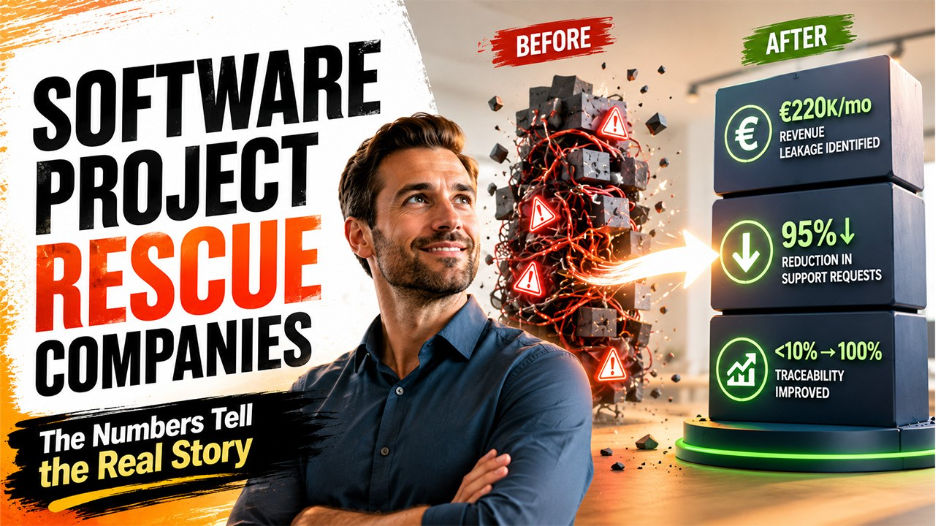

A software project rescue company takes over a stalled or failing project, determines why it stopped, and stabilizes it rather than starting over. The quickest way to separate real rescue experience from vague promises is to check whether the case studies include numbers.
The best software project rescue companies offer project rescue as a named service on their own websites. This article ranks them by the quantified outcomes they publish and what those numbers actually measure.
Most rescue pages sound the same: senior people, fast diagnosis, honest assessment. A case study with real numbers is different because it gives buyers something they can check.
What software project rescue companies publish, in numbers
For buyers comparing providers, this is closely related to the broader question of how to choose a software development agency.
- Only 5 of the 11 companies publish at least one rescue case study with hard numbers: ASD Team, ENO8, Intelvision Strike, Onix Systems, and SOLTECH. The other six publish no quantified rescue outcome.
- Intelvision Strike stands out because it is the only company with more than one quantified rescue case. Its three cases include €220,000 a month in identified revenue leakage, a €4.19 million modeled roadmap, and €508,000 to €1.05 million in expected annual loss from an untested recovery layer.
- Financial outcomes matter more than delivery activity. “35 user stories delivered” or “go-live five months later” shows progress, but figures tied to revenue leakage, roadmap value, or expected loss show what the problem was costing the business.
- Two companies publish strong numbers unrelated to rescue work: Above The Fray and Clear Measure. Those figures are useful, but they do not prove rescue experience.
- No company publishes an independently audited case study. Every number in this comparison is self-reported.
| Company | Quantified rescue cases published | What the numbers measure |
| Above The Fray | 0 (as rescue) | Four quantified cases exist on the site; none are labeled a rescue engagement |
| ASD Team | 1 | Vendor delivery activity — timeline, user stories, integrations |
| Clear Measure | 0 (as rescue) | A 96% deployment-time reduction exists on the auditing page, not tied to a rescue case |
| DOOR3 | 0 | A rescue engagement is described narratively, with no figures attached |
| ENO8 | 1 | Vendor delivery activity — schedule and budget performance |
| Intelvision Strike | 3 | Client business outcome — money, risk, and modeled ROI |
| Moravio | 0 (thin) | Scale is described (concurrent connections, team size); no before-and-after figures |
| Onix Systems | 1 | Technical/operational metrics — support-ticket and bug-rate reduction |
| Radixweb | 0 (spend only) | Client spent hours, with no delivery or outcome figures |
| Saritasa | 0 | Two cases are tagged as takeovers; a testimonial cites a time saving, but no case carries outcome figures |
| SOLTECH | 1 | Vendor transition speed — handover time and time to go-live |
Read the last column carefully. 5 companies publish numbers, but they measure different things. That difference matters more than the number of case studies, and the next section explains why.
What should a case-study number tell you?
The key question is whether the number describes the vendor’s work or the client’s business.
The five companies with published numbers fall into three groups:
- Vendor throughput numbers show delivery speed, such as the ASD Team’s three-month MVP, ENO8’s six-week delivery, and SOLTECH’s handover in a few days.
- Technical metrics show system improvement, such as Onix Systems’ 95% drop in support requests, 30% fewer legacy bug reports, and 35% fewer critical post-launch issues.
- Business outcome numbers show financial impact, such as €220,000 a month in revenue leakage, a €4.19 million modeled roadmap, and €508,000 to €1.05 million in modeled annual risk.
All three are useful, but only business-outcome numbers answer the buyer’s real question: will this pay for itself? Intelvision Strike is the only company here that publishes that kind of number, and it does so three times.
The 11 best software project rescue companies, by case-study depth
The list is alphabetical on purpose. Publishing three case studies does not prove a company is three times better at rescue work. It proves it publishes more evidence, which buyers still need to weigh against the rest of the shortlist.
Each company below is assessed on the same four fields, based on what it published on its own website as of 29 July 2026.
Above The Fray
- Quantified case(s) published: none labeled as a rescue. Four case studies elsewhere on the site carry real numbers — including a data pipeline processing 20 million-plus pricing records in under ten minutes, down from a process that previously took weeks.
- What the number(s) measure: technical throughput, on a project not described as a rescue.
- The strongest one, in its own words: the pricing-pipeline figure is specific and dramatic, but it sits on a general development case study rather than the rescue offer itself.
- Not built for: buyers who want a quantified example of this company's rescue work specifically, rather than its development work generally. The firm's certified commerce-platform work (BigCommerce, Shopify, Shopware, and Magento) is well documented; the rescue-specific version of that same evidence is not.
ASD Team
- Quantified case(s) published: one. A hospitality platform takeover delivered from discovery to a minimum viable product in three months, with 35-plus user stories and three major system integrations named.
- What the number(s) measure: vendor delivery activity — scope, timeline, and integration count.
- The strongest one, in its own words: a takeover with a stated scope and a stated timeline is a real, checkable claim, even though it does not say what the delay was costing the client before the team arrived.
- Not built for: buyers who need the case stated in business terms — cost avoided, revenue protected — rather than delivery terms. The firm's named travel and hospitality focus makes the single case a plausible fit for that vertical, but it remains just one data point for a company with 80-plus staff.
Clear Measure
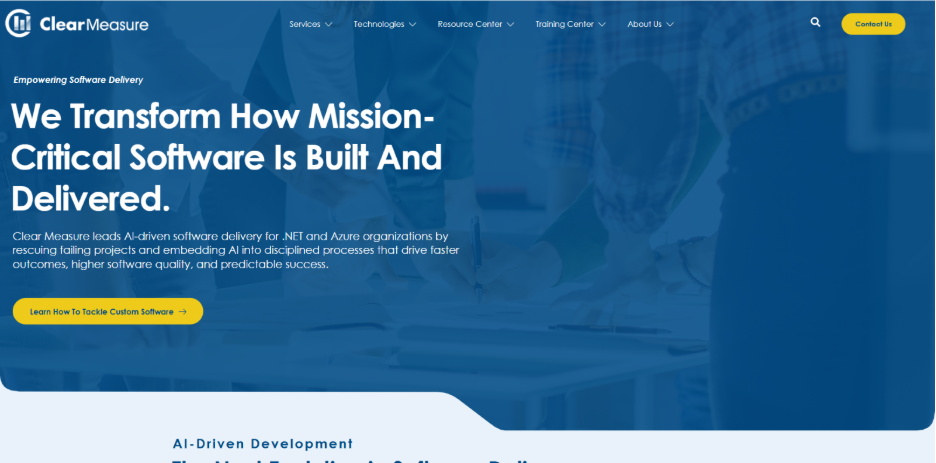
- Quantified case(s) published: none labeled as a rescue. A 96% reduction in deployment time — from 300 minutes to 11 — is published on the firm's auditing page, describing a real, specific technical result from an engagement not identified as a rescue.
- What the number(s) measure: deployment-pipeline performance.
- The strongest one, in its own words: the 96% figure is precise and verifiable in kind, if not in source; it simply is not attached to the rescue offer this article is comparing.
- Not built for: buyers who need the deployment result and the rescue engagement to match the published case. The firm's published thirty-point inspection and its exclusive .NET and Azure stack are the more detailed evidence here; a quantified rescue outcome using that same inspection has not been published alongside it.
DOOR3
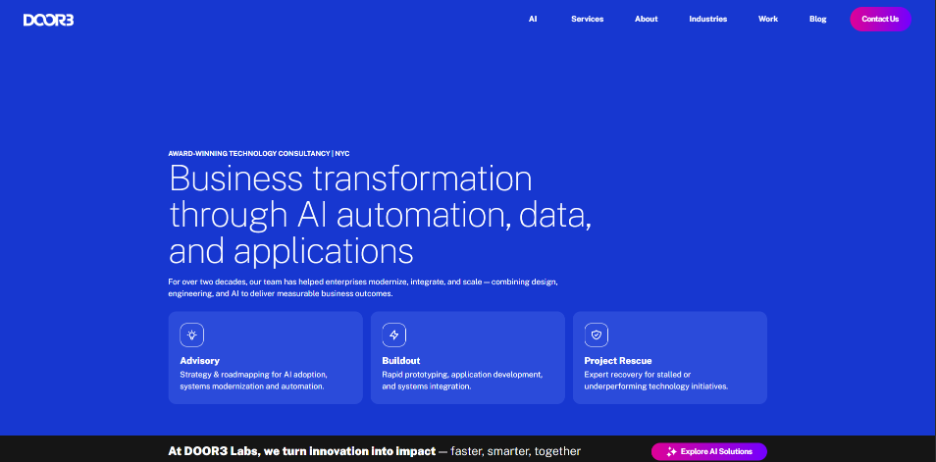
- Quantified case(s) published: none. One engagement is described as rescuing a stalled enterprise program left behind by a third-party vendor, yet it is narrated without a single figure attached.
- What the number(s) measure: nothing quantified is published; the description is qualitative.
- The strongest one, in its own words: the story itself — inheriting a stalled enterprise program from a departed vendor — is exactly the scenario a rescue buyer recognizes; it just is not backed by a number.
- Not built for: buyers who want the outcome of that story quantified rather than narrated. DOOR3 sells rescue as ten individually named services — repository takeover, timeline remediation, and so on — rather than as one bundled engagement, which may be part of why no single aggregate figure has been published: each of the ten would need its own.
ENO8
- Quantified case(s) published: one. A build that two previous delivery partners had failed to complete was delivered in six weeks against an eight-week plan and under budget.
- What the number(s) measure: vendor delivery activity — schedule and budget performance against the vendor's own estimate.
- The strongest one, in its own words: "two previous partners," is a strong, specific detail that most vendors omit because admitting a project has already failed twice makes the third attempt sound risky rather than reassuring—and ENO8 states it directly.
- Not built for: buyers who need the case stated as a business outcome rather than a schedule outcome. Consistent with the firm's published claim that most rescues trace to unclear scope, the case is framed around hitting a plan once it existed, not around what the earlier confusion had cost.
Intelvision Strike
- Quantified case(s) published: three — the deepest published set in this comparison. A B2B SaaS platform case identifies roughly €220,000 a month in delivery-related revenue leakage, with user-story-to-business-capability traceability moving from under 10% to 100%. A construction-sector case reaches a €4.19 million modeled roadmap over a 44-week phased plan against a roughly €500,000 investment. A funding-intermediary resilience case models an expected annual loss of €508,000–€1.05 million from a recovery layer that had never been tested, with a designed recovery time of under four hours.
- What the number(s) measure: client business outcome in all three cases — money at risk, money identified, or money modeled — rather than vendor delivery activity. This is the only company on this list that states outcomes this way, and it does so three times rather than once.
- The strongest one, in its own words: the software project rescue case reporting €220,000 a month in identified leakage, because the traceability figure alongside it — from under 10% to 100% — gives a before-and-after that a reader can check the logic of, not just the headline number.
- Not built for: buyers who want a large sample of quantified engagements rather than a small number of deep ones. Three is the deepest set published here, and it is still three, not thirty — a buyer weighing statistical confidence rather than case depth should read that plainly.
Moravio
- Quantified case(s) published: thin. A platform is described as handling hundreds of thousands of concurrent connections, and the delivery team's composition is listed, but no before-and-after figures are provided.
- What the number(s) measure: the scale of the system, not the change delivered to it.
- The strongest one, in its own words: the connection-count figure demonstrates the system can handle load; it says nothing about what the project looked like before Moravio's involvement.
- Not built for: buyers who need a stated before-and-after rather than a snapshot of current scale. The firm's own published headcount is inconsistent across pages (roughly 60, 50, or 45-plus, depending on which is read), which is a small but relevant sign that quantified self-reporting is not this company's strength, alongside an unusual anti-lock-in licensing stance that has nothing to do with case-study numbers but is worth knowing regardless.
Onix Systems
- Quantified case(s) published: one. A provider portal taken over from a failed vendor is published, resulting in a 95% drop in support requests; a client testimonial reports a 30% reduction in legacy bug reports and 35% fewer critical post-launch issues.
- What the number(s) measure: technical and operational improvement — support load and defect rate — attributed to the engagement.
- The strongest one, in its own words: three separate percentage figures pointing in the same direction is a stronger pattern than a single number, even without a stated monetary value attached to any of them.
- Not built for: buyers who need the improvement translated into its value to the business, rather than what changed in the system. The firm's healthcare subdomain publishes a separate claim—that about half of its healthcare engagements start as rescues—which is not itself a quantified outcome but a specific, checkable statement about how often this scenario occurs there.
Radixweb
- Quantified case(s) published: none as a delivery or outcome figure. One stalled-project story reports $12,000 invested and a further 40 hours of retainer work, describing client spend rather than what was delivered or achieved.
- What the number(s) measure: cost to the client, not outcome for the client.
- The strongest one, in its own words: the spend figures are concrete, but a number describing what was paid is a different claim from a number describing what was fixed.
- Not built for: buyers who want to know what the money bought, not only how much of it there was. For a company with 650-plus staff and offices across five countries, a single spend-only anecdote is a thin record relative to its scale.
Saritasa
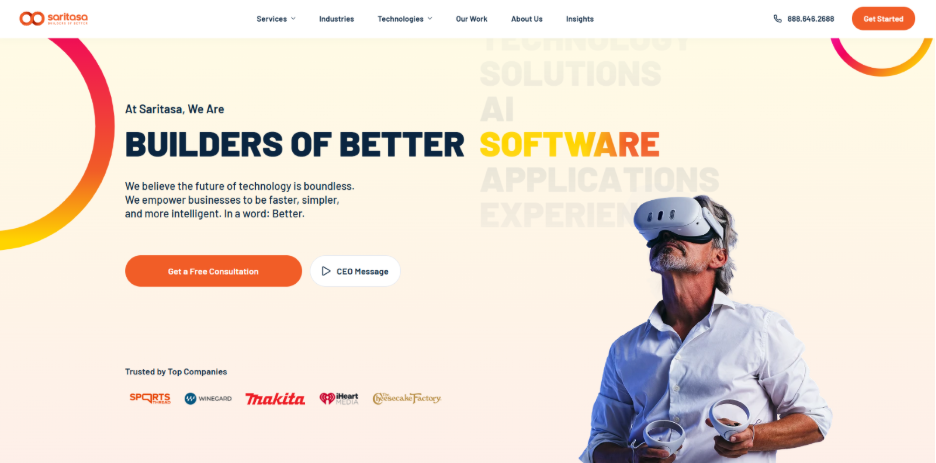
- Quantified case(s) published: none. Two case studies are tagged as code takeovers, and neither includes an outcome figure; a separate client testimonial reports that invoicing time was cut from ten hours a day to three or four, for work not identified as a takeover.
- What the number(s) measure: the testimonial figure measures a process-time improvement, on an engagement outside the takeover case studies proper.
- The strongest one, in its own words: the invoicing-time figure is specific and easy to verify in kind, but it is disconnected from the two cases actually labeled as takeovers.
- Not built for: buyers who want takeover-specific case studies to carry the same kind of numbers as the general testimonial. The rescue page itself is otherwise the most detailed single-page disclosure in this comparison on stack and industry breadth, which makes the absence of a matching outcome figure more noticeable, not less.
SOLTECH
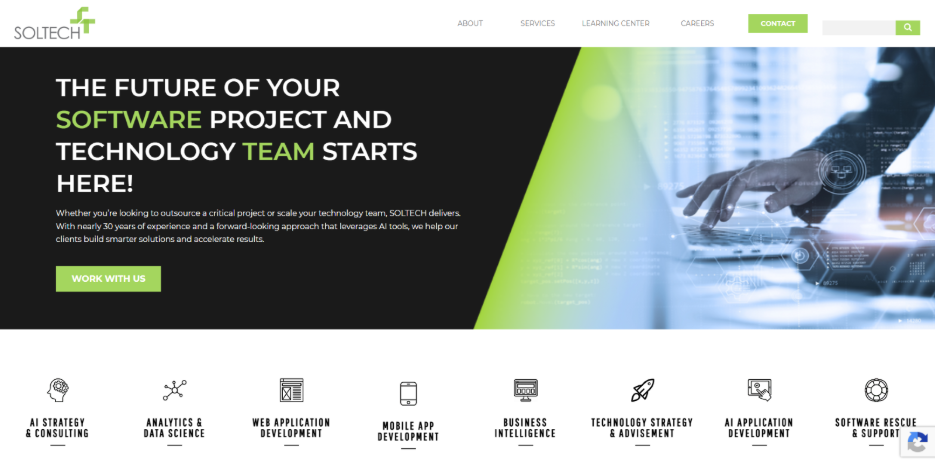
- Quantified case(s) published: one. Knowledge transfer from an outgoing vendor was completed "within a matter of a few days," with go-live reported five months later.
- What the number(s) measure: transition speed and time-to-live, both vendor-process metrics.
- The strongest one, in its own words: a stated handover duration is one of the more specific and least common figures on this entire list — most companies do not quantify transition speed at all.
- Not built for: buyers who need the case to state what the go-live was worth to the business, rather than how long the transition took to reach it. The firm also offers ongoing IT staffing after go-live, so the published figure covers only the handover itself, not the outcome of what came after it.
Do more case studies mean a safer bet?
Not automatically. One specific case is stronger than a marketing page with none, and three specific cases are stronger than one, as long as they are not treated as proof of audit-level certainty.
The limit is important: every case study here is self-published and unaudited. A company with no quantified case may still have strong, undisclosed rescue work. No number does not mean no result.
What a specific number gives buyers is something to test. “€220,000 a month in identified revenue leakage, with traceability moving from under 10% to 100%” invites real follow-up questions: team size, period, method, and measurement. “We deliver excellent results” does not.
How do you verify a case-study number before you rely on it?
Use three checks before trusting a rescue case study.
- Ask for the missing baseline. An “after” number, such as 300,000 concurrent connections, means less without the “before.” If the case study does not include it, ask.
- Ask who can confirm it. Since none of the 11 companies publish audited figures, a client reference is the only real verification step.
- Ask whether it is still current. Find out when the engagement ended and whether the vendor has a newer rescue case that it has not published. A “no” is useful information too.
Anatomy of a case study worth trusting
Intelvision Strike’s three cases are useful examples. Each starts with the client’s problem before showing numbers: a SaaS platform drifting from business goals, a construction firm wasting unmeasured admin capacity, and a funding intermediary with an untested recovery plan.
Each also gives a before-and-after, not just a final number: traceability moving from under 10% to 100%, or recovery moving from no tested path to a designed recovery time under four hours.
Most importantly, the numbers tie to business impact: monthly leakage, modeled roadmap value, or modeled annual loss. That matters more than vendor-only delivery metrics.
This is the structure to look for in any rescue case study. It still needs verification, since every case here is self-published and none is independently audited.
%201.png)

%201.png)

%201.png)